Blog Posts
Below are links to blog posts that I wrote for the Northwestern IT Research Computing and Data Services Blog.

Below are links to blog posts that I wrote for the Northwestern IT Research Computing and Data Services Blog.

|
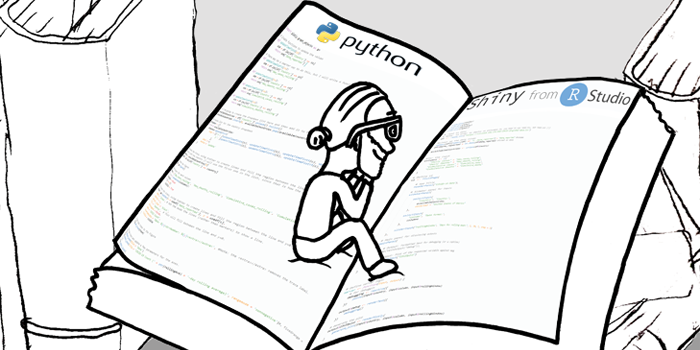
Experimenting with Shiny for Python Posted April 12, 2023 Shiny is a free, open-source, low-code utility for creating interactive figures that can be deployed to a website. R coders have been using Shiny and loving it since it was created in 2012. I personally am a Python coder at heart, though I have been learning R and Shiny steadily for the past year or so. I've been impressed by how effective and intuitive Shiny is ... |

|
Interactively Visualizing Millions of Data Points in a Web Browser Using Firefly Posted January 9, 2023 As datasets become larger and more complex, exploring and extracting information from them has become commensurately more difficult. Yet large and complex data sets are are often ripe for serendipitous scientific discovery via visualization. Firefly, ... |

|
How To Choose a Color Scheme for Your Scientific Figure Posted May 20, 2022 The choice of color(s) has a strong impact on the message that is conveyed in a scientific figure. It is therefore extremely important to think carefully about the color scheme you choose for your images and plots. A good choice in color scheme ... |
|
Comparing Python Interactives to R Shiny Posted March 30, 2022 This is a companion to my previous blog post, where I compared popular Python libraries for creating interactive figures. Here I will use the Shiny library in R and provide a narrative of my experience transitioning from Python interactives to R and Shiny. ... |

|
What is the Best Interactive Plotting Package in Python? Posted February 3, 2022 I love using, creating and teaching people about interactive figures. They can be incredibly useful tools for investigating your data and for sharing your data and research results with others. I recently went on a deep dive into the interactive plotting ecosystem of Python, and in this blog post ... |
|
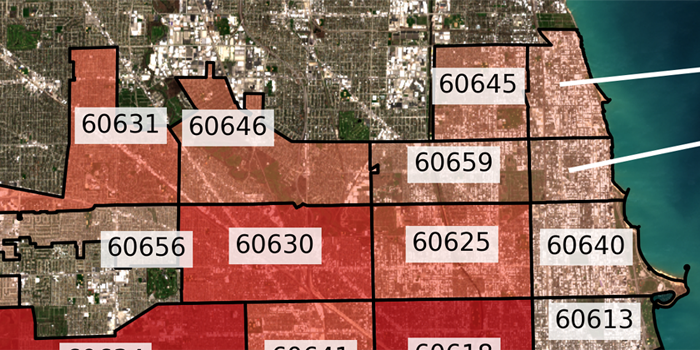
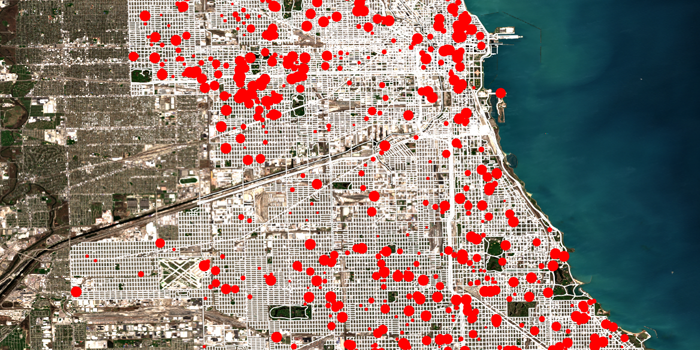
Plotting Geospatial Data with Python Posted January 4, 2022 Last month I wrote a blog post diving into the nitty gritty details about how to download a satellite image as a GeoTIFF file using Google's Earth Engine API in Python. I also shared my code in this GitHub repo so that you all can use it freely. Over the past few weeks ... |
|
Downloading Satellite Images Made "Easy" Posted November 19, 2021 Recently I went looking online for a satellite image of Chicago to use in an RCS workshop. I figured that a simple Google search would easily return a place to download a ready-made image of the city with latitude and longitude embedded that I could use ... |